Report Viewer
The goal of this project is to create a tool for building reports where the user experiences a tight and two way relationship between the code of the report and the viewing of the report. This is similar to the experience of using a spreadsheet (by clicking on a cell and viewing the formula) or using a notebook like Mathematica or jupyter notebooks (where the output of the code is interwoven into the code itself).
I want to give the author instant feedback when developing the report and I want to give the viewer of the report direct access to the code that generated what they are interested in.
What makes this project novel is it attempts to accomplish this while keeping the code in a source file, so the experience of writing code is able to leverage all of the developer tools that are available in a modern coding environment (e.g. version control, editors, code sharing, etc.).
To understand how this project endeavours to accomplish this let us consider a sample report file.
package Reports/MapListVis

operator + = add

list = [1,2,3,6,22]

out = list_vis(
  list.map_List(\n ->
    content = concat_String(
      ["*number*_:_ ", int_to_String(n)]
    )

    markdown(content)
  )
)
The report files are written in a relatively new language called
bosatsu.
While you may not be familiar with the language the
syntax is not difficult and is similar to python or ruby. (The one thing that may
be surprising is that you have to explicitly define operators like + which is
done here with operator + = add which simply means that 1 + 2 is the same as add(1,2).)
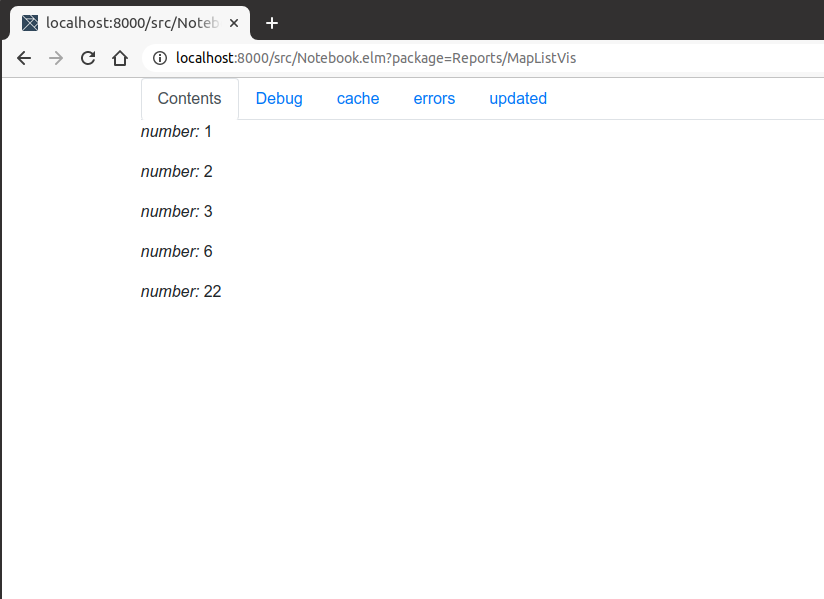
The whole report is the final assignment to out, which is a visualization. There
are currently three types of visualizations:
header: prints some text in big bold lettersmarkdown: prints a formatted markdown stringlist_vis: takes a list of visualizations (including another list_vis) and prints them out vertically
By convention each visualization takes exactly one argument. In the future there will be visualizations for tables and charts and interactive parameters.
If you want to step through the source you will find it is taking a list of numbers, formatting each
number into a string, wrapping the string with a markdown, and wrapping the whole list into a list_vis.
So the result of that report is a list of strings.
This gets a little more exciting when you see what happens when you edit the report. The report instantly responds by updating the affected portions.
What is more exciting is the debug tab. Since a report is nested visualizations it
is helpful to put a box around each visualization; in this case a box for each markdown
and one large box around the list_vis. In the corner of each box is a selector to
display debugging information below.
The debugging information is hard to make out in the image so I have copied the first 4 below.
1814418855
list_vis
App(App(Recursion(Lambda(Lambda(Match(LambdaVar(0),PositionalStruct(0,),Lambda(LambdaVar(0)),PositionalStruct(1,Var(0),Var(1)),Lambda(Lambda(Lambda(App(App(LambdaVar(4),LambdaVar(2)),Struct(1,LambdaVar(1),LambdaVar(0)))))))))),App(App(Recursion(Lambda(Lambda(Match(LambdaVar(0),PositionalStruct(0,),Lambda(LambdaVar(0)),PositionalStruct(1,Var(0),Var(1)),Lambda(Lambda(Lambda(App(App(LambdaVar(4),LambdaVar(2)),Struct(1,App(ExternalVar('Bosatsu/Predef','markdown', 'Bosatsu/Predef::String -> Bosatsu/Predef::Vis'),App(ExternalVar('Bosatsu/Predef','concat_String', 'Bosatsu/Predef::List[Bosatsu/Predef::String] -> Bosatsu/Predef::String'),Struct(1,Literal('*my number*_:_ '),Struct(1,App(ExternalVar('Bosatsu/Predef','int_to_String', 'Bosatsu/Predef::Int -> Bosatsu/Predef::String'),LambdaVar(1)),Struct(0,))))),LambdaVar(0)))))))))),Struct(1,Literal(1),Struct(1,Literal(2),Struct(1,App(App(ExternalVar('Bosatsu/Predef','add', 'Bosatsu/Predef::Int -> Bosatsu/Predef::Int -> Bosatsu/Predef::Int'),Literal(20)),Literal(5)),Struct(1,Literal(6),Struct(1,Literal(22),Struct(0,))))))),Struct(0,))),Struct(0,))
1022177032
markdown
App(ExternalVar('Bosatsu/Predef','concat_String', 'Bosatsu/Predef::List[Bosatsu/Predef::String] -> Bosatsu/Predef::String'),Struct(1,Literal('*my number*_:_ '),Struct(1,App(ExternalVar('Bosatsu/Predef','int_to_String', 'Bosatsu/Predef::Int -> Bosatsu/Predef::String'),LambdaVar(1)),Struct(0,))))
    1 - Literal(1)
-1055032311
markdown
App(ExternalVar('Bosatsu/Predef','concat_String', 'Bosatsu/Predef::List[Bosatsu/Predef::String] -> Bosatsu/Predef::String'),Struct(1,Literal('*my number*_:_ '),Struct(1,App(ExternalVar('Bosatsu/Predef','int_to_String', 'Bosatsu/Predef::Int -> Bosatsu/Predef::String'),LambdaVar(1)),Struct(0,))))
    1 - Literal(2)
-1022292293
markdown
App(ExternalVar('Bosatsu/Predef','concat_String', 'Bosatsu/Predef::List[Bosatsu/Predef::String] -> Bosatsu/Predef::String'),Struct(1,Literal('*my number*_:_ '),Struct(1,App(ExternalVar('Bosatsu/Predef','int_to_String', 'Bosatsu/Predef::Int -> Bosatsu/Predef::String'),LambdaVar(1)),Struct(0,))))
    1 - App(App(ExternalVar('Bosatsu/Predef','add', 'Bosatsu/Predef::Int -> Bosatsu/Predef::Int -> Bosatsu/Predef::Int'),Literal(20)),Literal(5))
The first line is a hash of the third line and all the lines after. This is useful for inspecting the cache, and for seeing when the expression has or has not changed.
The second line is the type of visualization.
The third line is the normalized expression for the visualization argument. That is to say that this is what the source is parsed into, and then normalized, and will be executed.
The fourth line (and beyond) is the scope or context for the expression. Note that they are also normalized expressions and can have their own context. Note how the third entry in the list of numbers is 20 + 5 and how the scope in the debug information starting with -1022292293 is not 25 but is actually an expression
to add 20 and 5 together.
In general parsing and normalizing is fast, but execution can be slow. Since execution is deterministic, this allows the report viewer to avoid doing any redundant execution which makes interactions feel more responsive. It also means that if the execution is taking a lot of time a place holder can be seen on the report viewer while the user waits for the actual result.
The goal is to eventually have source maps for these expressions and then display the actual source the user wrote that is producing this visualization. Perhaps the user will eventually be allowed to edit the source in the viewer itself and see live updates.
Speaking of live updates, of course you can make edits while your viewer is on the debug tab and only the affected aspects of the rendering will change. This means your selection in the debug view does not change, but the expression and output does.
If you look closely you would notice that when the variable name changed from n to number that nothing changed. That is because these sorts of changes are normalized away and the viewer is able to recognize that re-running the execution would not result in a new value, so it uses the cache.
This allows for quite a bit of refactoring without having to re-run your code. And you also have confidence that these refactors do not change the outcome.
This is barely a proof of concept. There is a lot left to do to make this useful and the opportunity for a lot of interesting features.
- There needs to be a way to work with tabular data that usually makes up reports.
- There needs to be visualizations for the tabular data,
table,linechart,barchart. - There needs to be a way to query a database, or at least import csv data.
- There should be the ability to have parameter visualizations so that the reports can be interactive.
- There is an opportunity to move a lot of the execution into the browser. Currently all execution happens on the server but it may be possible to inspect the expression and determine which executions should run in the browser. Particularly useful for parameter changes.
- and a lot more
If you have found this page and it interests you, please let me know. You can find me on Twitter or email me at steven dot noble at gmail dot com.